| A Do-It-Yourself Custom Zone System Gray Scale | |
|
|
| | |
| WHAT IS IT? | |
| | |
| |
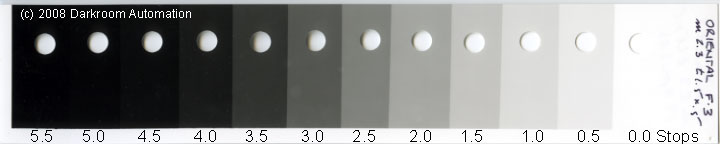
The scale is designed as an aid to determine printing exposure. It shows the tones a paper will produce when exposed to equal stop increments of exposure, and shows the tones of the Zone system as applied to your particular paper, developer and toning. This custom zone strip does not have the standard zone system densities, but it is far more far more useful in a practical make-a-print sense.
Commercially available grey scales either show tones at equal density intervals (useful for sensitometry) or at the standard Zone system grey tones (useful to have an idea what a 'standard' Zone looks like). Neither is much of a direct aid with your printing.
The original Zone system tones were the tones that resulted from exposing a sheet of film at one stop intervals and printing it under standard conditions on #2 paper. As the film had a 9 stop range from black to white when printed on grade #2 paper the Zone system ended up with 10 tones. The standard Zone system densities and tones were an average found by Ansel Adams through his experimentation. These densities have become standards so that everyone agrees on what a particular zone represents. Ansel Adams did not specify densities for the zones when a print is made, but a set of standard densities for print zones has evolved by consensus.
However, each material has it's own set of tones that it produces when its tonal range is broken into 10 (or so) equal exposure intervals. By using these tones, rather than a set of standard tones, it is easy to see the effect of a constant change in exposure and also to determine how much of a change in exposure is required to move a point on an image from one tone to another. The scale above was made with Oriental RC graded glossy F grade 3 paper. The scale was exposed at 0.5 stop intervals from just-pure-white to just-maximum-black. The holes were made with a paper punch and help in matching tones. Place the hole over the tone to be matched and defocus your eyes - when the tones match the punched hole disappears.
|
| | |
| HOW DO I USE IT? | |
| | |
| |
As an aid to visualization. It shows the standard tone values you may want to aim for when making a print. As a guide to the paper curve. It gives an idea of the paper response, especially in the toe and shoulder regions.
As a guide to exposure. If you have the Darkroom Automation Enlarging meter the scale will show you how much exposure you need to give to the paper to make that particular tone.
As a guide to correcting exposure. By comparing tones on a work print with the tones on the gray scale you can determine how many stops of increase, decrease, dodge or burn are needed to move the print tones to where you want them.
An example, you make a print but aren't satisfied with the looks of the sky:
|
| | |
| HOW DO I MAKE ONE? | |
| | |
| Using a Darkroom Automation f-Stop Timer | |
| | |
| |
For most normal grade papers: Make a test strip to find the find the just-not-white exposure. Use this time as the base time and make a 10 position test strip at 0.5 stop intervals. Use a smaller interval for harder papers and a larger interval for softer papers. To make the 10-zone interval scale first make a test strip to find the minimum max-black exposure. Divide the difference between the minimum max-black and the just-not-white exposures by 10 and use this for the interval. Example: The exposure for just-not-white is 4.1, and the exposure for minimum max-black is 7.4 stops. The difference is 7.4 - 4.1 = 3.3. Make a test strip with a 4.1 base exposure at 0.3 stop intervals - this is your zone scale. |
| | |
| If you have the Darkroom Automation Precision Enlarging Meter | |

|
|
| |
You may want to note the absolute exposure on the zone scale. The base exposure (f-Stop Timer setting + meter reading) you used for the strip would be under the lightest patch, and the values would increase at the test strip interval you used.
|
| | |
| Using a conventional timer | |
| | |
| |
The easiest method is to use a 1/2 stop interval test strip. This works well enough for most normal grade papers. The number of zones between white and black isn't really important to the use of the scale - you can make it 20 zones if you like.
For a 0.5 stop interval strip determine the just-not-white time with a test print. If you can manage it so that this time is 5 seconds then the sequence of times is an easy one to remember: advance a covering strip exposing for 2.0 seconds, 2.8 seconds, 4.0 seconds .... If the starting time is 10 seconds then the sequence would be 4.0 seconds, 5.6 seconds, 8 seconds ... The starting point doesn't have to fall exactly on the lightest paper tone, you can start before that and use one of the sequences above - the only important point is that the exposures are an equal number of stops apart.
You can find other sequences in these spread-sheets: Quatro Pro Zone times and Excel Zone times. The paper speed charts in the support section of the Darkroom Automation web site can give you some idea of the range in stops from white to black for some papers.
|